 010:28
JupyterLiteBeginner
Open JupyterLite and run your first line
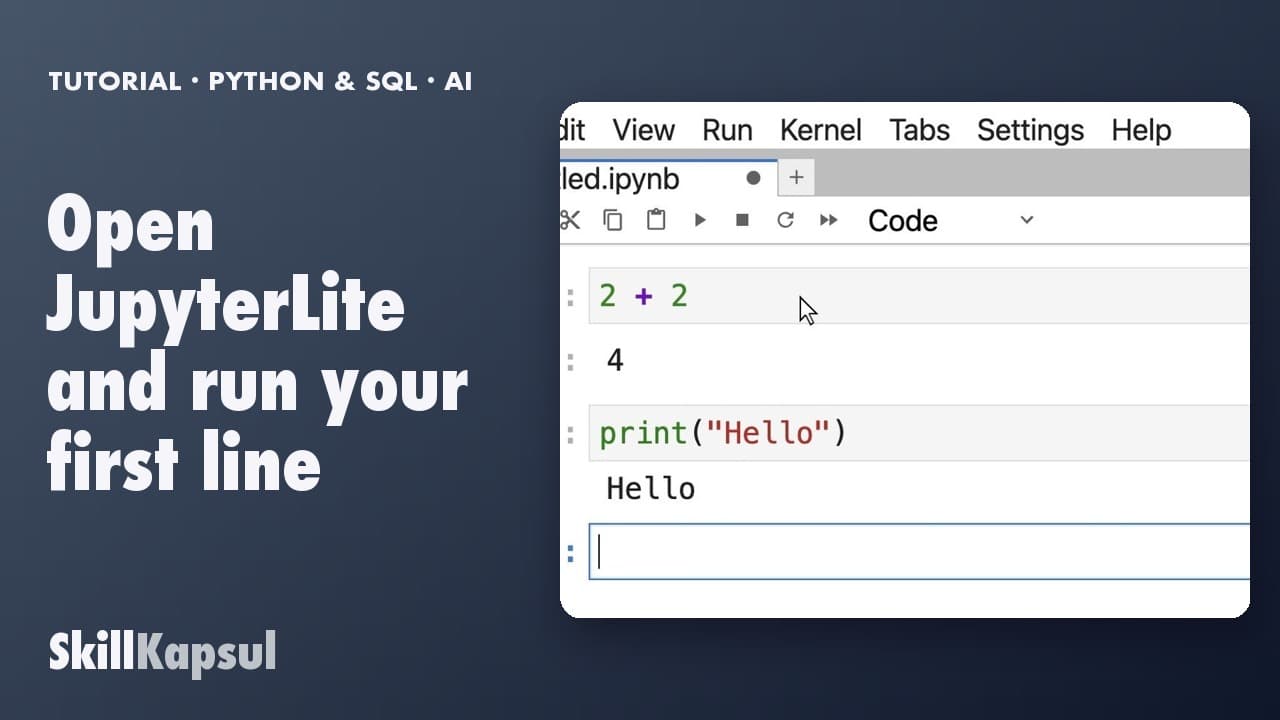
You open a Python notebook in your browser, with no account and nothing to install, and run your first cell.
Catalogue · First steps in Python and SQL, with AI
You turn a total by store into a bar chart, in a single line.
Space: play · ← →: 5 seconds · M: sound · F: full screen
The exact sequence, in order.
Start from the total by store, by_store.
Type by_store.sort_values().plot(kind="barh", title="Revenue by store (€)");
The final semicolon hides a technical line.
Shift + Enter: twelve horizontal bars, Lyon Croix-Rousse at the top.
The habit to keep
The chart shows the same numbers as the table, nothing more.
You might also like
010:28You open a Python notebook in your browser, with no account and nothing to install, and run your first cell.
 020:24
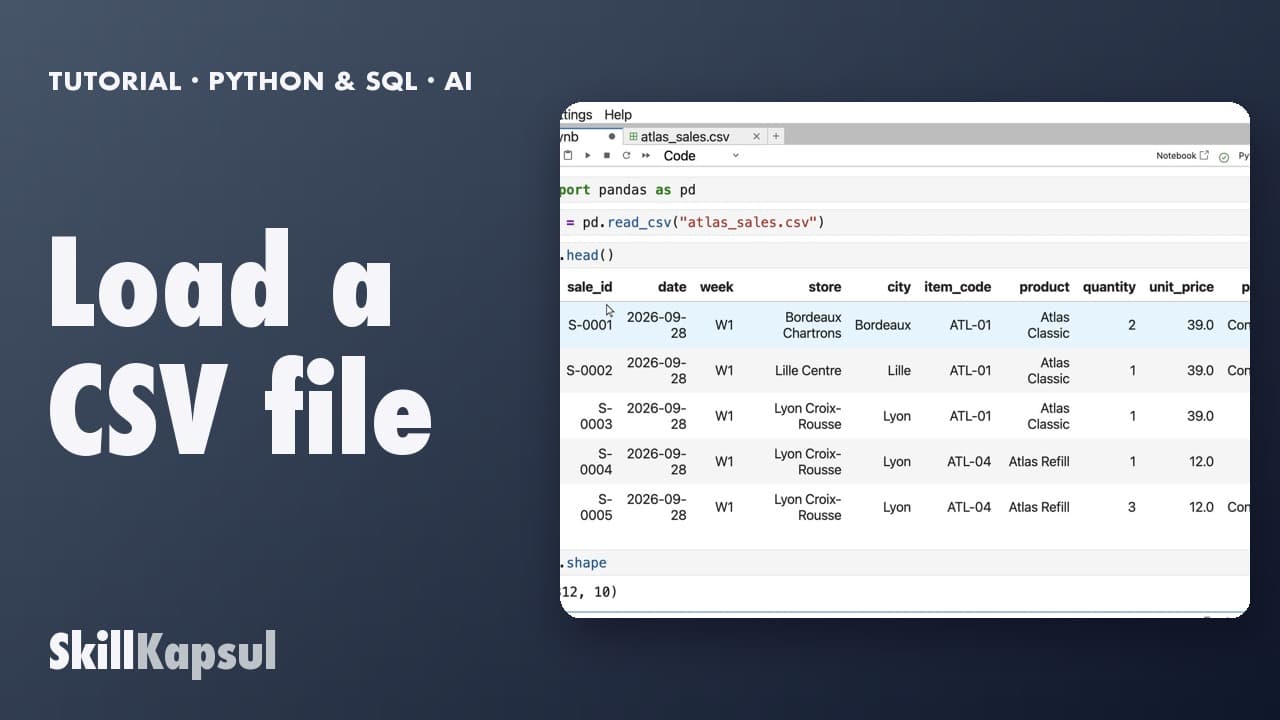
You load a sales export with pandas and see its first rows and its size.
 030:26
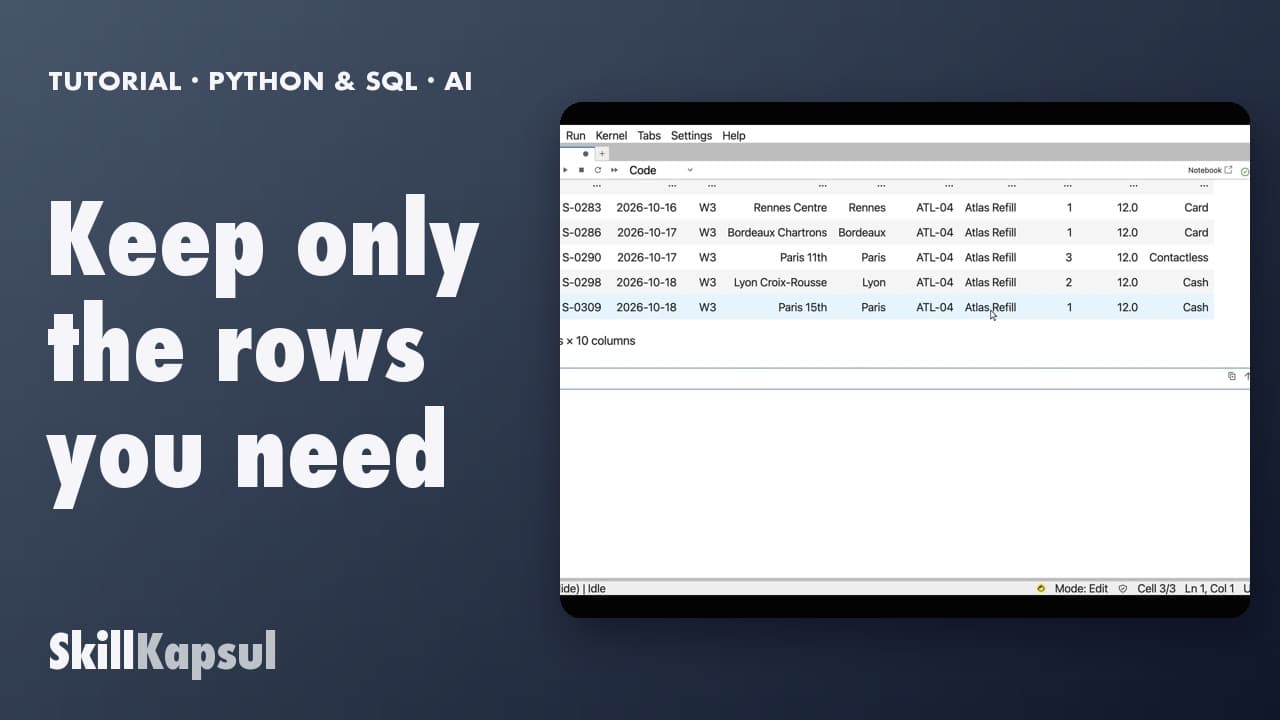
You filter a table on a value: a city, a product.
Newsletter
One skill a week, straight to your inbox. The easiest way to keep learning without thinking about it.
Your data stays in the EU. Never sold.